Client: Investment management firm
Users: Investment analysts, portfolio managers
Computation, storage, and display of proprietary analytics for a volatility-based portfolio management methodology.
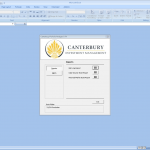
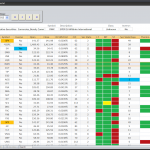
Computation sub-system for screening securities implemented via an Excel add-in with an MSForms UI:
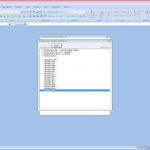
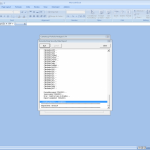
- Retrieves price data from the web, loads the function library, populates a calculation template, and computes the metrics for each security in the universe.
- Accumulates current values and filters and ranks the securities in custom groups.
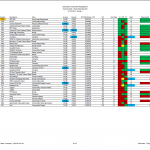
- Generates data in various formats (xlsx, csv, pdf) for presentation or downstream processing.
- Daily output is the foundation of a live strategy with $250 million in assets under management.
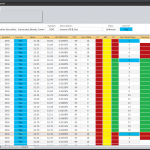
Storage sub-system is a time-series database which stores price data, pre-computed metrics, and custom attributes for a universe of ETF’s:
- Provides historical and cross-section views of the data in a color-coded scheme.
- Enables the analyst to filter and sort the data through an intuitive GUI.
- Serves as the primary source of input to the testing process for rule-driven trading models.
- Computation – Main
- Computation – Progress
- Computation – Final
- Computation – Output
- Storage – Trading Day View
- Storage – Security View
